On Density and Synchrony
Temporal coordination is about timing. Work and school schedules, transport services, parking, and energy use can be staggered or load balanced to avoid overload at any one moment. Tools include flexible work hours, congestion pricing, and off-peak utility tariffs. Some activities require synchrony, such as assembly lines or collaborative office work.
Spatial coordination is about location. Co-location means more people in one place, i.e. a higher density, drawing on the same set of services and infrastructure. That concentration enables efficient public transport, more shops and amenities nearby, and economies of scale in infrastructure. The Mohring effect is one example: more transit riders justify more service, which lowers wait times, which increases ridership. For roads, however, avoiding co-location at the same time is essential to reduce congestion, which the process of user equilibration in route choice helps to spread and mitigate.
The core claim is that cities work best when spatial and temporal coordination are designed together. High density can either flatten peaks or create new ones, depending on whether schedules and behaviours are synchronised. Policy needs to consider both clocks and maps.
EVIDENCE ON COMPLEMENTARITY
Are time and space substitutes or complements? Do high-density (Crowded) areas have less peaking, and/or vice versa? Sometimes yes, sometimes no:
Transport: Dense cores sustain ridership all day, while suburbs swing between empty and overcrowded. In New York City, the morning peak now accounts for about one-third of Manhattan-bound entries (7–10 a.m.)—33% in 2022, down from roughly half in earlier decades (NYMTC Hub Bound Travel 2022; RPA’s Hub-Bound Travel). Off-peak commuting has grown 39% since 1990, compared with 17% for peak-hour trips (NYC Comptroller, Left in the Dark). European cities like Berlin, with frequent all-day metro service, show strong off-peak use (Levy, Pedestrian Observations). By contrast, on Boston’s MBTA commuter rail, ~83% of inbound trips occur in the AM peak (MBTA).
Utilities: Dense grids can produce extreme synchronous spikes, especially during hot weather when many households use air-conditioning at once (Waite et al., 2017). Yet density can also flatten peaks: in Chicago, clustering of smart-meter load shapes shows that areas with long public-transport commutes have distinct, less spiky morning profiles, while car-oriented suburbs show sharper spikes (Acosta-Sequeda et al., 2023).
Amenities: Dense districts sustain multiple activity peaks across the day (commute, lunch, evening). Using NYC street-camera data, researchers find a characteristic three-peak weekday pedestrian-flow structure rather than a single surge (Dobler et al., 2021).
Work: Large cities host varied schedules—service, shift, gig, students, so by 2018 only about 53% of NYC transit commuters traveled in the traditional 7–9 a.m. window, down from 61% in 1990 (NYC Comptroller, Left in the Dark). Flexible-hours policies shift departures out of the peak; for example, Evidence shows flex-time lowers pre-peak travel by ~7% and raises post-peak by ~7% (He 2013, ). In many suburban job markets with uniform 9–5 patterns, peak hours are narrow, with a single hour often around 8–12% of daily road traffic (FHWA Traffic Monitoring Guide).
Density alone does not guarantee smoother demand. It can both flatten and amplify peaks, depending on whether behaviour is synchronised. What matters is the interaction between temporal and spatial coordination.
A TWO-DIMENSIONAL FRAMEWORK
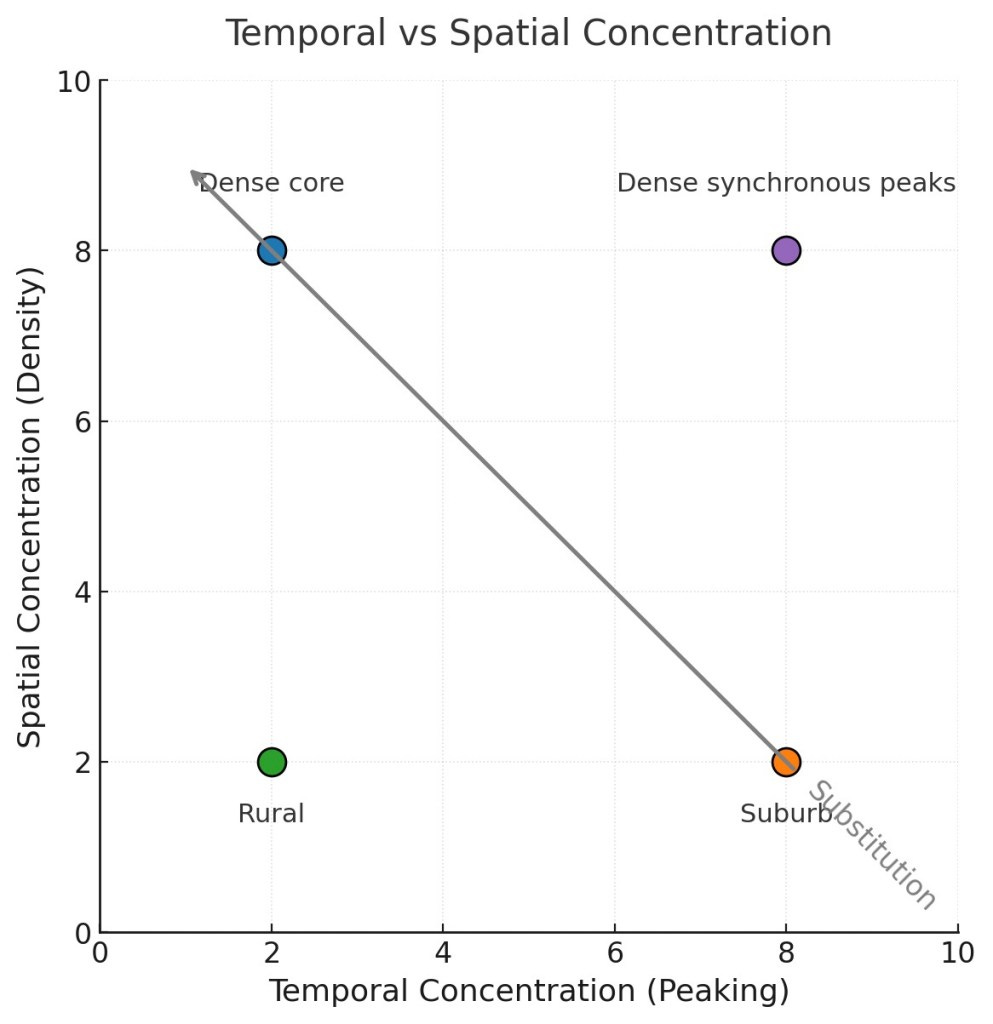
Urban systems depend on when activity happens and where it is located. The figure shows temporal concentration (X-axis) and spatial concentration (Y-axis). A diagonal arrow illustrates substitution: more spatial concentration can support less temporal concentration, and the reverse.
Rural, low demand (bottom-left): Low density, low activity. Peaks are small but service stretched thin.
Dense core, smooth demand (top-left): High density, mixed uses, frequent service. Peaks are muted.
Suburb, sharp peaks (bottom-right): Low density, long trips, limited uses. Peaks dominate.
Dense synchronous peaks (top-right): Behaviour aligns in time, as with evening electricity surges or stadium events.
This chart makes the substitute or complement question concrete. Moving up increases spatial concentration, moving right increases temporal concentration. In some systems, more of one allows less of the other. In others, they move together.
WHY SUBSTITUTION HAPPENS
Service frequency: High base demand supports higher frequency, cutting waiting time and flattening peaks.
Shorter trips and mixed use: Closer origins and destinations spread activity through the day.
Schedule diversity: Varied jobs and lifestyles reduce alignment on a single clock.
MANAGING EXCEPTIONS AND PEAKS
Even where density and diversity smooth demand, certain triggers can still create sharp spikes.
Shared clocks: Even in dense, diverse cities, common time signals like Georgia Tech’s steam whistle, school start times, office hours, televised events, or stadium schedules can align behaviour and generate sharp peaks.
Bottlenecks: A single constrained link, whether a freeway bottleneck, a rail chokepoint, or a power substation, can force large flows into a narrow channel, creating artificial peaks independent of density or diversity.
End-use surges: Environmental triggers (heat waves, cold snaps) or collective habits (everyone cooking dinner at 6 p.m.) can produce sudden, synchronised surges in energy, transport, or service demand.
POLICY LEVERS
Because peaks cannot be eliminated, managing them requires coordinating temporal and spatial strategies.
Temporal tools: Shift demand left along the temporal axis. Adjust schedules or prices to spread demand over time. Examples include flexible work and school hours, off-peak pricing for transit or utilities, and adaptive traffic signals that shift capacity in response to real-time conditions.
Spatial tools: Pull activity up along the spatial axis while trying not to push it right into dense synchronous peaks. Shape urban form so that activity is naturally spread. Policies include infill and “missing middle” housing, mixed-use zoning that reduces trip bunching, fine-grained street networks that disperse flows, and station-area planning to place daily needs within walking distance.
The aim is not a single point on the chart but a workable bundle of spatial and temporal choices that keeps peaks within capacity while maintaining access.
Density is neither good nor bad for peaks on its own. What matters is how we schedule it.