Evaluating the Safety In Numbers effect for pedestrians at urban intersections
Recently published:
Murphy, Brendan, David M. Levinson, and Andrew Owen (2017) Evaluating the Safety In Numbers effect for pedestrians at urban intersections. Accident Analysis & Prevention Volume 106, September 2017, Pages 181–190. [doi] [free until August 14, 2017]

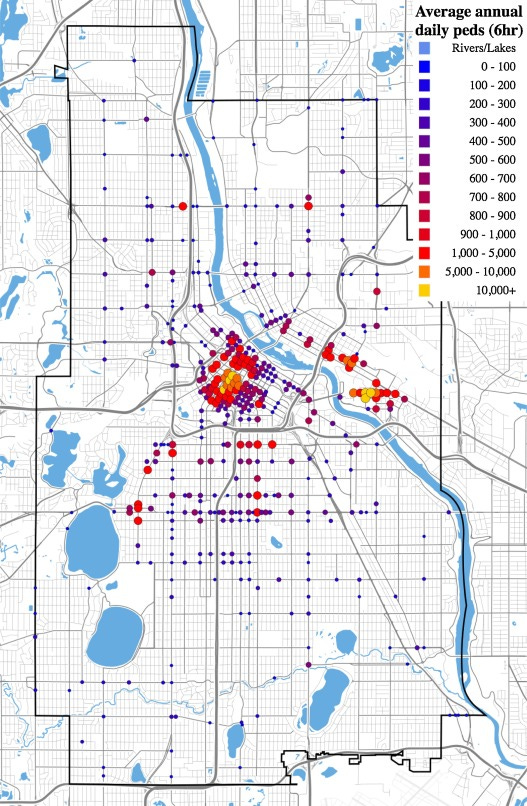
Average annual 6-hour pedestrian count by location, Minneapolis
Highlights
Collision risk at 448 intersections in the city of Minneapolis, MN was assessed.
The Safety In Numbers phenomenon was observed for both pedestrians and cars.
Maps of per-pedestrian crash rates inform discussion of safe vs. unsafe city areas.
Abstract
Assessment of collision risk between pedestrians and automobiles offers a powerful and informative tool in urban planning applications, and can be leveraged to inform proper placement of improvements and treatment projects to improve pedestrian safety. Such assessment can be performed using existing datasets of crashes, pedestrian counts, and automobile traffic flows to identify intersections or corridors characterized by elevated collision risks to pedestrians. The Safety In Numbers phenomenon, which refers to the observable effect that pedestrian safety is positively correlated with increased pedestrian traffic in a given area (i.e. that the individual per-pedestrian risk of a collision decreases with additional pedestrians), is a readily observed phenomenon that has been studied previously, though its directional causality is not yet known. A sample of 488 intersections in Minneapolis were analyzed, and statistically-significant log-linear relationships between pedestrian traffic flows and the per-pedestrian crash risk were found, indicating the Safety In Numbers effect. Potential planning applications of this analysis framework towards improving pedestrian safety in urban environments are discussed.
Keywords
Pedestrians;
Safety;
Collisions;
Urban planning

