Comparing measures of auto accessibility
This note compares the original Access Across America, using 2010 data (A2010), released in April 2013 with the most recent Access Across America: Auto 2015 (A2015), which was released in September 2016.
Auto accessibility to jobs at 8:00 in 2015.
As we write in A2015:
An earlier report in the Access Across America series took a different methodological approach approach to evaluating accessibility across multiple metropolitan areas. [A2010] used average speed values and average job densities across entire metropolitan areas, rather than detailed block-level travel time calculations, to estimate job accessibility. Because of these differences, the results of that report cannot be directly compared with those presented here.
Thus it is important to note that almost all differences between the two reports can be attributed to differences in methodology, rather than changes over time due to different land use patterns or travel speeds. We anticipate that as subsequent reports come out annually in the 2016-2020 time period, a methodologically consistent time series will be available enabling substantive comparisons of accessibility over time across the United States.
A2010 used a macroscopic approach to computing accessibility, as a function of average network speed, circuity by time band, and average employment density for the region, constrained so that accessibility did not exceed the region’s number of jobs.

ρ_emp = Urban area employment density (jobs · km^−2).
t = time threshold.
V_n = Average network velocity in km · h^−1
C_t = Average circuity of trips (ratio of actual distance to Euclidean distance) in time threshold (ex: 20-min threshold measures circuity of trips 0-20min).
The methodology is outlined in detail in Network Structure and City Size.
In addition, A2010 assumes that regions do not interact. So a traveler in the Baltimore region, for instance, only has a available jobs in Baltimore, not jobs in the Washington, DC. If the representative traveler for Baltimore could reach all of Baltimore’s jobs in 40 minutes, then the 50 and 60 minute accessibility would be the same. The same phenomenon is especially important in Baltimore, Hartford, Los Angeles, Providence, Raleigh, Riverside, San Francisco, San Jose.
A2010 used 2010 travel speeds (metropolitan averages on arterials and freeways from Inrix) and 2010 Census data.
A2015, used a microscopic approach to computing accessibility, making a separate computation for each census block in the United States. A2015 used 2015 link-level travel speeds (essentially every road segment in the US has a speed provided by TomTom based on their GPS data collection program). Jobs by Census block from the Census LEHD program were also employed, using data from 2013 LEHD at the census block level.
There are additional differences in geographies about how the two reports defined areas, as Census definitions of metropolitan areas may have changed.
While the results are similar in terms of order of magnitude, they differ in specific ways.
If we accept A2015 as “ground truth”, as it is far more detailed in its use of data and accurate in assumptions, the expected biases A2010 are as follows:
Relative to A2015, A2010 underestimates access in regions that adjoin other region, particularly at longer travel time thresholds, because it does not consider jobs in other regions as available and because it uses average speeds, which are too high for short trips and too low for long trips.
Relative to A2015, A2010 overestimates access for short travel time thresholds, because it uses regional average speeds, rather than the lower speeds actually available for short trips that typically use less freeway.
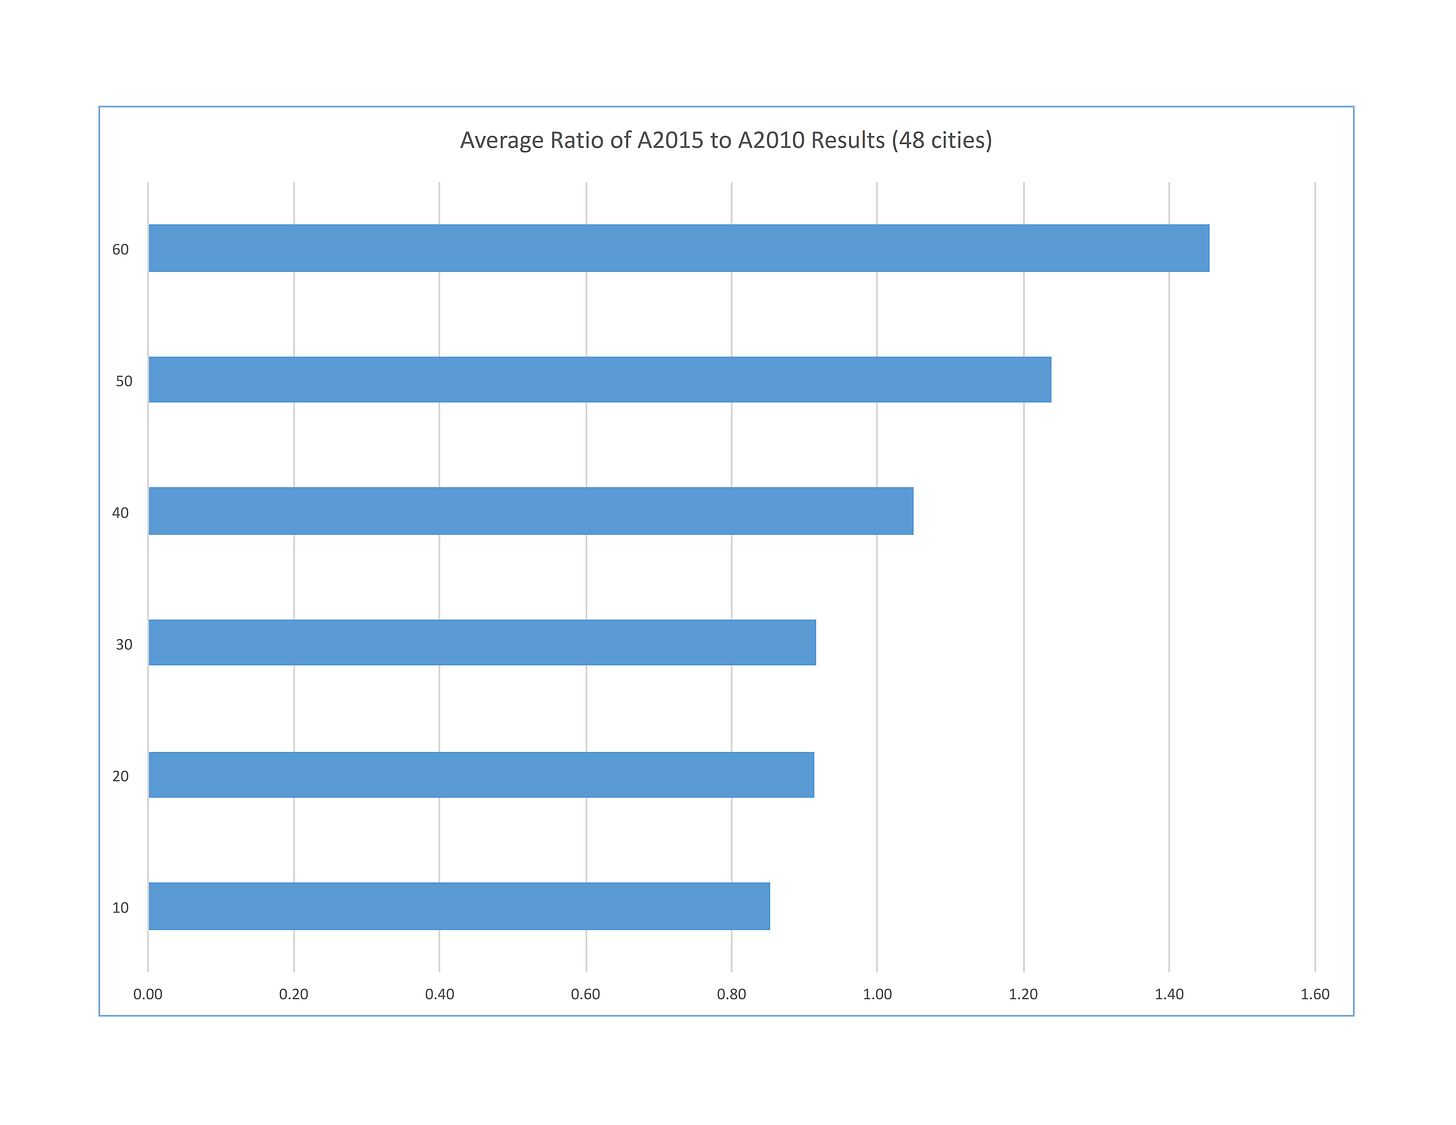
As shown in the figure below, this pattern is largely, but not uniformly, borne out by comparison of the metropolitan averages. On average, A2010 is higher than A2015 for thresholds of 10, 20, and 30 minutes, but higher for 40, 50, and 60 minutes. The averages are very close at between 30 and 40 minutes, longer than the average daily commute in these cities (a bit under 30 minutes on average).
I am actually surprised (and pleased) at how close the overall average is, given all of the assumptions that went into the macroscopic estimate. Macroscopic approximations can work well for a general understanding of the patterns of cities, but remain macroscopic and approximations. More detailed analysis is necessary to get at spatial differences and irregularities in those general patterns that we illustrate on the maps, differences that give life to individual cities.


