Access Across America: Transit 2017
My colleagues at the University of Minnesota just released Access Across America: Transit 2017. The time series here is a big deal, it is now possible to look at change at accessibility systematically from a national perspective, and compare cities. From the page:
Most U.S. metros increase access to jobs by transit
The 2017 edition of Access Across America: Transitreports that 36 of the 49 largest metros showed increases in job accessibility by transit. Though rankings of the top 10 metro areas for job accessibility by transit only changed slightly from the previous year, new data comparing changes within each of the 49 largest U.S. metros over one year helped researchers identify the places with the greatest increases in access to jobs by transit. Kansas City improved more than 17 percent. San Francisco, which ranks 2nd for job accessibility by transit, improved nearly 9 percent. In all, 42 of the 49 largest metros showed increases in job accessibility by transit.
“This new data makes it possible to see the change from year to year in how well a metro area is facilitating access to jobs by transit,” said Andrew Owen, director of the Observatory. “Transit is an essential transportation service for many Americans, and we directly compare the accessibility performance of America’s largest metropolitan areas.”
Key factors affecting the rankings for any metro area include the number of jobs available and where they are located, the availability of transit service, and population size, density, and location. Better coordination of transit service with the location of jobs and housing will improve job accessibility by transit.
Maps of cities with the greatest increases in job accessibility by transit
Maps of metropolitan areas with the greatest job accessibility by transit
Accessibility map of Kansas City
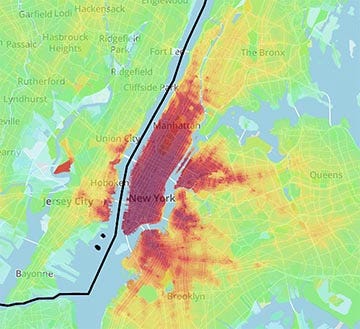
Accessibility map of New York City


